
Six numbers determine whether a rental property is quietly building wealth or slowly leaking it: net operating income, rent collection rate, occupancy, operating expense ratio, cap rate, and debt service coverage ratio. Track these monthly, and you catch cash flow problems before they become vacancy problems or, worse, foreclosure problems. Skip them, and you're managing a property by gut feel, which works right up until it doesn't.
TL;DR:
- Tracking rent collection rate, occupancy, and operating expense ratio monthly identifies early cash flow issues and prevents vacancies or foreclosure risks.
- Adding cap rate and debt service coverage ratio becomes essential once managing more than a few units to support acquisition and financing decisions.
- Regularly reviewing lease expiration schedules and diversifying lease end dates helps avoid simultaneous turnover peaks that strain resources.
- Maintaining a detailed CapEx reserve and monitoring turnover costs prevent unexpected large expenses and support long-term property health.
- Using clear thresholds and assigning owners to each KPI ensures prompt corrective action, improving overall property performance and value.
Table of Contents
- What Are the Core Rental Property KPIs?
- How Do You Calculate the Core Financial KPIs?
- How Do You Measure Rental Income Health?
- How Do You Track Tenant Stability and Turnover Costs?
- What Are Healthy Operating Expense Benchmarks?
- How Often Should You Review Property Management Metrics?
- How Do You Build a KPI Scorecard With Real Thresholds?
- Where Does Your KPI Data Actually Come From?
- How Milwaukeepm Applies These KPIs in Practice
- How Do You Measure Tenant Satisfaction and Feedback?
- What Are Lease Expiration and Rollover Rates?
- How Should You Track and Budget for CapEx?
- How Do You Project and Monitor Cash Flow?
- How Do You Analyze Market Rent Growth and Comparables?
- Which KPIs Should You Track First as Your Portfolio Grows?
- How Milwaukeepm Turns KPI Data Into Action
- Sources
- FAQ
What Are the Core Rental Property KPIs?
Property management metrics fall into four functional buckets, and understanding which bucket a metric belongs to changes how you use it. Lumping every number into one undifferentiated spreadsheet is how owners end up with reporting fatigue and no clear next action.
- Return metrics answer "is this property making money relative to what I put into it?" Think cap rate, cash-on-cash return, and DSCR.
- Income health metrics answer "is billed rent actually becoming banked cash?" Think rent collection rate and economic occupancy.
- Stability metrics answer "how much am I losing to tenant churn and vacant days?" Think turnover rate, renewal rate, and days vacant.
- Expense control metrics answer "where is money leaking on the cost side?" Think operating expense ratio and maintenance cost per unit.
A single-property investor can start with four KPIs: NOI, rent collection rate, occupancy, and OER. That combination catches most early warning signs without demanding a full-time bookkeeper. As a portfolio grows past three or four doors, add cap rate tracking for acquisition decisions and DSCR if you're carrying institutional debt. Grouping metrics this way, rather than tracking two dozen numbers with no hierarchy, is what a practical KPI framework recommends, and it's the difference between a scorecard that gets reviewed and one that gets ignored.
How Do You Calculate the Core Financial KPIs?
These four numbers drive valuation, lending decisions, and the fundamental question of whether a property belongs in your portfolio.
- Net Operating Income (NOI) equals gross rental income minus operating expenses, excluding debt service and depreciation. A duplex generating $2,400 a month in rent with $800 in monthly operating costs (maintenance, insurance, taxes, management fees) produces an NOI of $1,600 a month, or $19,200 annually.
- Cap rate equals annual NOI divided by current property value or purchase price. That same duplex, purchased for $240,000, yields a cap rate of 8%. Cap rate is the metric appraisers and buyers use to value income property, and the NARPM financial performance guide treats NOI improvement as the direct lever behind valuation gains, since even modest monthly NOI increases compound into meaningful price appreciation once you run them back through the cap rate.
- Cash-on-cash return equals annual pre-tax cash flow divided by total cash invested. If you put $60,000 down on that duplex and net $9,600 a year after debt service, your cash-on-cash return is 16%. This metric matters most to investors using leverage, since it isolates the return on your actual cash outlay rather than the full asset value.
- Debt Service Coverage Ratio (DSCR) equals NOI divided by annual debt service. A DSCR of 1.25 means the property generates 25% more income than it needs to cover loan payments. Most lenders want to see 1.2 to 1.25 minimum; conservative owners target 1.35 or higher to build in a buffer for a bad year.
Each of these numbers tells a different story, and none of them substitutes for the others. A property can have a great cap rate and a dangerous DSCR if it's overleveraged.
How Do You Measure Rental Income Health?
Billed rent and collected rent are two different numbers, and the gap between them is where a lot of owners get surprised at tax time.
- Rent collection rate equals total rent collected divided by total rent billed, expressed as a percentage. Well-run residential portfolios typically collect in the high 90s percent of billed rent, and anything trending below that consistently signals either a tenant quality issue or a collections process problem.
- Day-5 collection rate tracks what percentage of rent comes in by the fifth of the month, before late fees typically apply. This is a leading indicator: portfolios that see day-5 collection slipping often see full month-end collection deteriorate a month or two later, giving you a head start on intervention.
- Effective Gross Income (EGI) equals gross potential rent minus vacancy loss and credit loss. It's the realistic income number, as opposed to the optimistic "if every unit were full and every tenant paid" number.
- Economic occupancy differs from physical occupancy: physical occupancy counts occupied units, while economic occupancy measures the percentage of potential rent actually collected. A unit occupied by a tenant who's three months behind isn't contributing to economic occupancy even though it's physically full.
- Delinquency aging buckets (0 to 15 days, 16 to 30 days, 31 to 60 days, 60-plus days) tell you which accounts need a phone call versus which need a legal notice. A tenant in the 60-plus bucket needs a different response than one who's five days late for the first time.
How Do You Track Tenant Stability and Turnover Costs?
Every vacant day costs you rent, and every turnover costs you money before a new tenant ever pays a dime. Stability metrics quantify both.
- Vacancy rate is the percentage of units sitting empty at a point in time; stabilized conventional multifamily typically targets occupancy in the mid-90s percent range, and pushing past 97% occupied can actually signal underpricing rather than success, since it means you likely could have charged more without losing the tenant.
- Days vacant should be measured from the prior tenant's move-out date to the new lease's start date, then broken into three components: turn time, marketing time, and downtime. Splitting the number this way tells you whether the bottleneck is your maintenance crew, your marketing reach, or scheduling gaps between the two.
- Renewal rate is the percentage of expiring leases that renew rather than turn over.
- Turnover cost per unit should include make-ready labor and materials, lost rent during vacancy, marketing spend, and leasing commissions.
A typical single-family turnover runs somewhere between one and two months of gross rent once you add up paint, cleaning, minor repairs, marketing, and lost rent during the vacancy window. Faster, more targeted rental property marketing can shrink the marketing-time component of days vacant meaningfully, which is often the easiest lever to pull compared to speeding up maintenance crews.
Pro Tip: Before offering a renewal incentive, run the math: a $50 monthly discount to retain a tenant for 12 months costs $600. A full turnover on that same unit, factoring lost rent and make-ready costs, often costs two to three times that. The discount usually wins.
What Are Healthy Operating Expense Benchmarks?
The Operating Expense Ratio (OER) equals total operating expenses divided by effective gross income. A property running an OER between 35% and 50% is generally considered healthy for residential rentals; older properties or those with higher amenity loads can run higher without necessarily being mismanaged.
Splitting expenses into controllable and non-controllable categories focuses your attention where it actually helps.
- Controllable costs: maintenance labor, vendor selection, marketing spend, staffing decisions.
- Non-controllable costs: property taxes, insurance premiums, utility rate increases.
- Maintenance cost per unit should be tracked monthly and watched for repeat-work patterns. Three service calls on the same HVAC unit in six months is a signal to replace, not repair again, and tracking HVAC repair costs across a portfolio systematically is one of the more overlooked ways owners catch this pattern before it becomes an expensive lesson.
- Make-ready cost per turn amortized against the lease term gives you a true cost-per-month figure that belongs in your turnover cost calculation, not off to the side as a one-time expense.
How Often Should You Review Property Management Metrics?
The right cadence depends on how quickly a metric can go wrong and how quickly you can act on it once it does.
- Daily: new delinquencies, emergency work orders, and units without a scheduled showing. These need same-day eyes because delay compounds the cost.
- Weekly: delinquency aging progression, vacancy funnel status, and leasing pipeline activity. A weekly check catches a stalling lease-up before it becomes a month of lost rent.
- Monthly: the full scorecard, including NOI, OER, occupancy, and rent collection rate. This is your owner-facing report and your primary decision-making checkpoint.
- Quarterly: rent positioning against market comparables, turnover cost per unit trends, and capital expenditure planning. These move slowly enough that weekly review would just create noise.
This cadence structure, recommended across industry KPI guidance, matches review frequency to how actionable each metric actually is rather than reviewing everything on the same calendar, which is how most reporting fatigue starts.
How Do You Build a KPI Scorecard With Real Thresholds?
A scorecard only works if every metric has a threshold and an owner attached to it. A number sitting in a spreadsheet with no green, yellow, or red zone is just trivia.
- Present each KPI with its current value, prior-month value, and the delta, so trend direction is visible at a glance.
- Assign a named action and a named owner to every yellow or red reading. "Vacancy at 8%, action: increase marketing spend, owner: leasing manager" beats a bare number every time.
- Escalate anything in red for two consecutive months to a portfolio-level review rather than a unit-level fix.
Pairing each metric with a threshold and an accountable owner is exactly what KPI scorecard design principles call for, since a metric without an assigned action tends to get reported and then forgotten.
| KPI | Green | Yellow | Red |
|---|---|---|---|
| Rent collection rate | 97%+ | mid-90s percent range | below typical collection benchmarks |
| Occupancy | mid-90s percent range | low 90s percent | Below 90% |
| OER | around 35% to 45% | between 35% and 50% | above 50% |
| DSCR | 1.35 or higher | 1.2 to 1.25 | below 1.2 |
These bands are general reference points, not universal rules; a luxury property with high amenity costs may run a higher OER without a problem, and local vacancy norms shift with broader market conditions tracked in the Census Bureau's Housing Vacancy Survey.
Where Does Your KPI Data Actually Come From?
You don't need enterprise software to start tracking KPIs well, but you do need clean source data.
- Accounting ledger: the source for income, expenses, and NOI calculations.
- Tenant ledger: the source for rent collection rate, delinquency aging, and day-5 collection.
- Maintenance log: the source for work order volume, repeat visits, and make-ready costs.
- Leasing funnel: the source for showing counts, application rates, and days vacant.
A single owner with a handful of units can run this entirely in a spreadsheet with one tab per KPI bucket. Once you're managing more than roughly ten to fifteen units, or juggling multiple owners' portfolios, a dashboard tool that pulls directly from your accounting system saves hours and reduces manual entry errors. Either way, run a monthly close checklist: reconcile the bank deposit against the tenant ledger, confirm every work order has a closed status or a documented reason it's still open, and verify occupancy count matches your unit roster before you finalize the scorecard.
How Milwaukeepm Applies These KPIs in Practice
The company builds its owner reporting around standard financial and operational metrics, tracking rent collection, occupancy, and expense ratios as monthly deliverables rather than annual afterthoughts.
Owners and tenants each have access to a dedicated portal, which facilitates rent collection tracking and provides real-time visibility into delinquency status rather than waiting for a month-end summary. Local neighborhood-level rent knowledge feeds into occupancy and rent positioning decisions, accounting for shifts in local comparables.
- Detailed monthly reporting is structured to mirror the scorecard format outlined above, so owners see NOI, occupancy, and collection rate trends without digging through raw transaction data.
Owners can request a sample KPI report to see this reporting format before committing to a management agreement.
How Do You Measure Tenant Satisfaction and Feedback?
Tenant satisfaction doesn't show up on a balance sheet directly, but it drives nearly every stability metric that does. A tenant who feels heard renews. One who feels ignored starts browsing listings the moment their lease allows it.
Practical satisfaction metrics include maintenance response time (hours from request to acknowledgment, and days from request to completion), first-contact resolution rate on maintenance issues, and a simple post-service satisfaction score collected after every work order closes. Net Promoter Score, adapted for rental housing, asks tenants how likely they are to recommend the property or renew, on a zero-to-ten scale, and tracks the trend over time rather than treating any single score as gospel.
Complaint volume and complaint category are worth tracking separately from satisfaction scores. A spike in noise complaints points to a different fix than a spike in maintenance complaints, and lumping them into one generic "tenant issues" count hides the pattern. Renewal rate itself functions as a lagging satisfaction indicator: if renewal drops in a specific building or unit type while others hold steady, that's a signal worth investigating before the lease-end conversation even happens.
The practical value here is speed. A tenant satisfaction metric that surfaces a problem in week one, rather than at lease renewal, gives you months of runway to fix it instead of a binary choice between losing the tenant or scrambling.
What Are Lease Expiration and Rollover Rates?
Lease expiration tracking answers a deceptively simple question: how many leases end in any given month, and are they clustered dangerously together? A lease expiration schedule lists every unit's lease end date across the next 12 months, and it's one of the most underused planning tools in a rental portfolio.
Rollover rate measures the percentage of leases that convert to month-to-month or renew on a new fixed term versus terminate outright at expiration. A portfolio with 15 units all expiring in June has a scheduling problem waiting to happen: that's 15 simultaneous marketing pushes, 15 simultaneous showings, and potential simultaneous vacancy if a chunk of them don't renew.
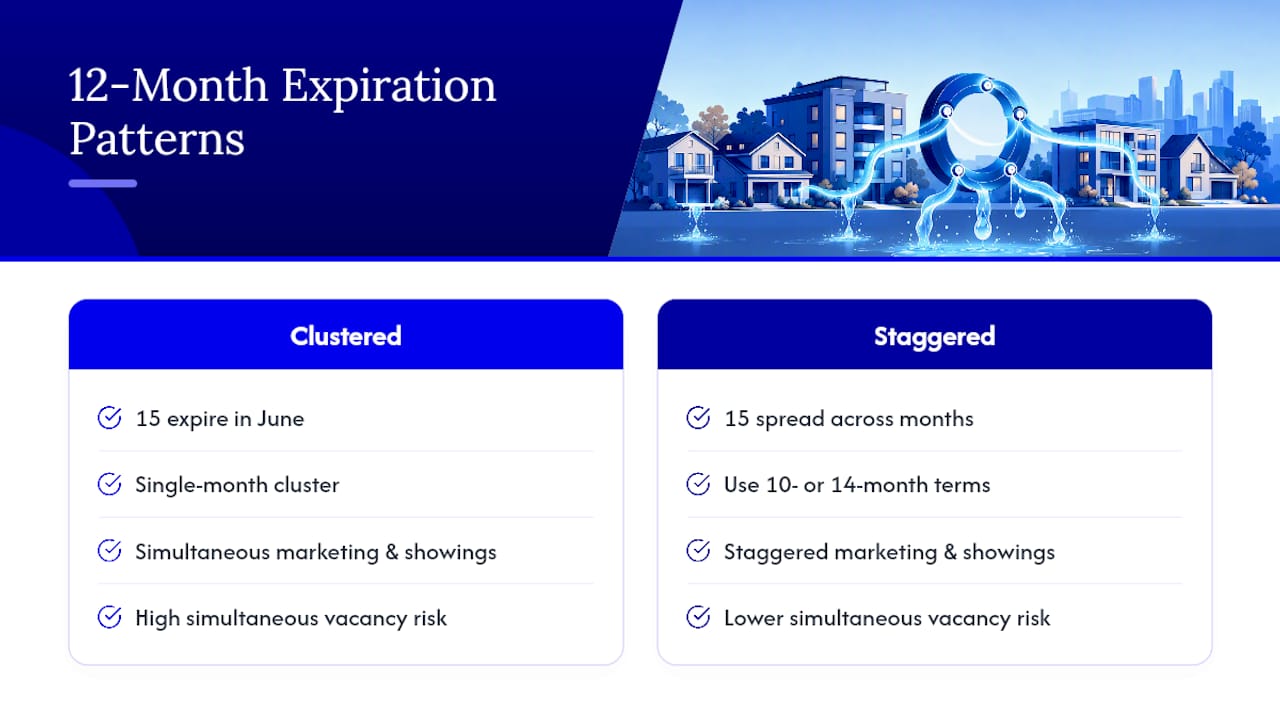
The fix is staggering lease terms deliberately. Offering a 14-month or 10-month initial lease on select units, rather than defaulting every lease to exactly 12 months, spreads expiration dates across the calendar and reduces the odds of a rollover cluster hitting during a seasonally slow leasing month. Tracking this at the portfolio level, not just the unit level, is what separates a proactive leasing calendar from a reactive one where every renewal conversation happens under time pressure.
How Should You Track and Budget for CapEx?
Capital expenditures, unlike routine maintenance, extend the life of an asset rather than just keeping it running: a roof replacement, a new HVAC system, exterior painting, or a full kitchen renovation all qualify. Confusing CapEx with operating expenses is one of the more common reporting mistakes owners make, and it distorts both your OER and your true NOI picture.

A CapEx reserve should be funded monthly, not pulled together in a scramble when the roof finally fails. A common rule of thumb sets aside somewhere between $200 and $300 per unit per year for older properties, adjusted up for properties with aging major systems and down for newer construction. That reserve gets tracked as a separate line item from operating expenses, and it should never get raided to cover a bad month's cash flow shortfall without a plan to replenish it.
A simple CapEx budget tracks four columns: the item, the expected year of replacement based on system age, the estimated cost, and the funding status. Reviewing this quarterly, alongside your turnover cost and rent positioning review, keeps a $12,000 furnace replacement from becoming a surprise instead of a scheduled event. Properties that skip this step tend to fund CapEx with debt or with a sudden cash call to the owner, both of which are more expensive than a reserve built over years.
How Do You Project and Monitor Cash Flow?
A cash flow projection starts with expected collected rent (not billed rent) for the next 12 months, subtracts projected operating expenses and debt service, and layers in known CapEx timing from your reserve schedule. The output is a month-by-month number that tells you when cash is tight, not just whether the year averages out fine.
Monthly monitoring compares actual cash flow against the projection and flags variance immediately. A property that projected $1,800 in monthly net cash flow but delivered $900 has a story behind that gap, whether it's a vacancy that ran longer than modeled or an unexpected repair. Catching that variance in the month it happens, rather than at year-end tax prep, is the entire point of running projections in the first place.
Seasonal patterns matter here too. Rental markets in colder climates often see slower leasing in winter months and faster turnover in summer, which means a flat monthly projection understates risk in the slow months and overstates confidence in the busy ones. Building seasonality into your projection, even roughly, produces a far more useful early-warning system than a simple annual average divided by twelve.
How Do You Analyze Market Rent Growth and Comparables?
Rent comparables analysis, often called a rent comp study, means pulling current asking rents for three to five similar units within a half-mile to one-mile radius, matched on bedroom count, square footage, and amenity level. Doing this quarterly, rather than only at lease renewal, keeps your pricing grounded in what the market will actually bear right now.
Market rent growth tracks the year-over-year percentage change in achievable rent for your unit type and submarket.
The occupancy benchmark discussion earlier applies directly here: occupancy sitting consistently above 97% is often the clearest signal that your rent comp analysis is overdue, since a market rarely absorbs a unit that easily unless it's priced below where comparable units are landing.
Which KPIs Should You Track First as Your Portfolio Grows?
Start with NOI, rent collection rate, occupancy, and OER if you're managing one to three units. That four-KPI foundation catches the problems most likely to actually hurt you: a tenant who's stopped paying, a unit sitting empty too long, and expenses creeping past what the rent supports.
Depth beats breadth here. Tracking four KPIs accurately and reviewing them on schedule outperforms tracking fifteen KPIs sporadically with data you don't fully trust. Once you're past a handful of units, add DSCR and cap rate for acquisition and refinance decisions, and start layering in turnover cost and CapEx reserves as retention and long-term asset planning become bigger levers than simple occupancy.
— Chaim
How Milwaukeepm Turns KPI Data Into Action
Tracking KPIs tells you something is wrong. Fixing it is a different job, and it's the one Milwaukeepm actually does. Where a spreadsheet flags rising vacancy or a slipping collection rate, Milwaukeepm's owner and tenant portals put that same data in front of you in real time, backed by a local Milwaukee team that handles the marketing, screening, and maintenance coordination needed to fix what the numbers reveal.
Some property management services offer a tenant guarantee: if a placed tenant leaves within the first year, the unit is re-rented at no additional charge, helping hedge against turnover costs. Services include full-service property management, property maintenance and unit turnovers, and detailed monthly reporting built around the same scorecard categories in this guide. If you want to see how your own numbers stack up, request a sample KPI report and review current management pricing to see exactly what a monthly management fee covers.
Sources
FAQ
What Is the 7% Rule for Rental Property?
The 7% rule is a rough acquisition screen suggesting a rental property's annual gross rent should equal roughly 7% of its purchase price to indicate a potentially strong cash-flowing deal. It's a quick filter, not a substitute for running actual NOI, cap rate, and cash-on-cash calculations before buying.
What Are the 5 Main KPIs for Rental Property Owners?
Most owners track NOI, rent collection rate, occupancy rate, operating expense ratio, and either cap rate or DSCR depending on whether they're evaluating a purchase or managing existing debt. These five cover income, cash health, expenses, and return in one compact set.
What Are Key Performance Indicators for a Real Estate Company?
Beyond the core financial metrics, real estate companies track tenant turnover rate, days vacant, renewal rate, and maintenance cost per unit as operational KPIs. Milwaukeepm structures its own monthly reporting around this same combined financial and operational set.
What Are the 5 P's of Property Management?
Definitions of the "5 P's" vary across the industry, but common versions include property, people, price, promotion, and process, reflecting the mix of physical asset care, tenant relationships, rent pricing, marketing, and operational systems that property management involves.
How Much Does Milwaukeepm Charge for Property Management?
Milwaukeepm charges 10% per month for management, a $650 one-time fee for new tenant placement, and no charge for lease renewals, listed on its pricing page. Setup and onboarding carry no separate fee.