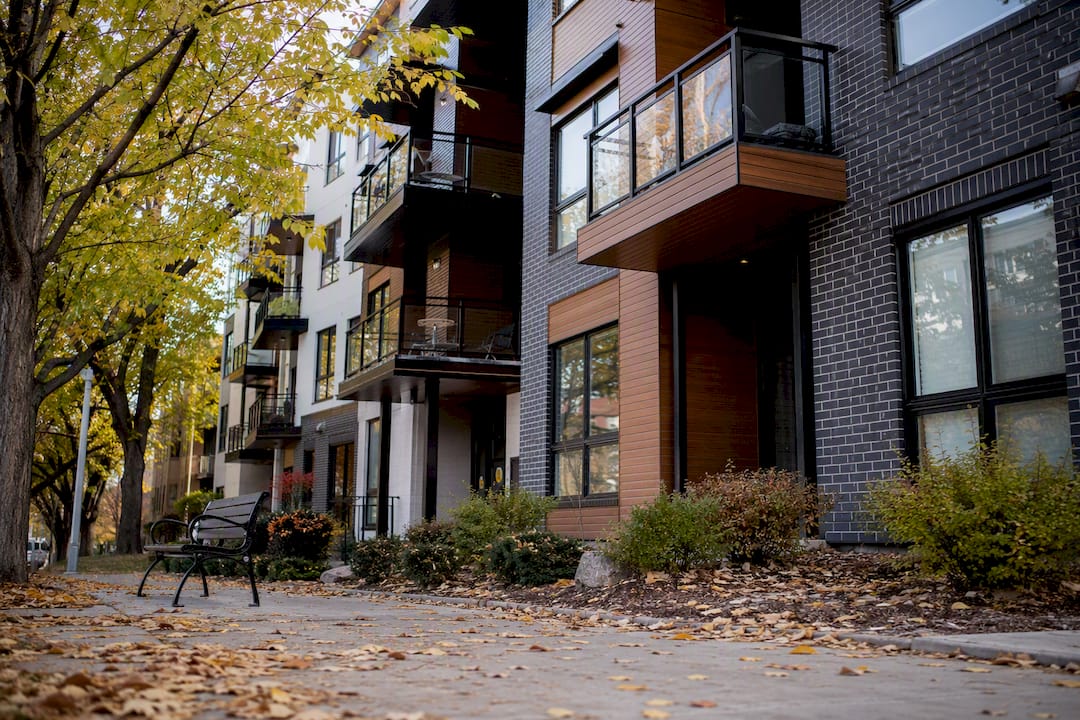
Milwaukee's rental market has flipped in favor of renters. Vacancy jumped from 4.9% in 2024 to 10.8% in 2025, while typical asking rent sits near $1,469 on Zillow's ZORI index. A construction boom in new multifamily buildings, not falling demand, is the reason. Landlords now compete harder, and renters have real negotiating room for the first time in years.
TL;DR:
- The Milwaukee rental market shift favors tenants, with vacancy rising to over 10% due to a surge of new luxury apartment construction rather than falling demand.
- Rent estimates vary: Zillow ZORI asks about $1,469, while ACS reports an average of $1,059 across all occupied units, reflecting different market segments.
- Most new supply targets high-end buildings, creating a split market where luxury units have higher vacancy and concessions, while older, affordable units remain tighter.
- Rent growth on new listings still outpaces inflation, with landlords offering concessions that reduce actual rent payments, making net-effective rent key for negotiations.
- Renters should leverage increased vacancy by asking for concessions and coming prepared, while owners and investors should model concessions carefully to protect income.
Table of Contents
- Understanding the Milwaukee Rental Market Right Now
- Why Vacancy Jumped: Construction, Permits, and Who Benefits
- Rent Trends: What Each Index Is Telling You
- Where Rent and Vacancy Differ Across Milwaukee ZIP Codes
- Affordability: Who Gets Priced Out and Where HUD Fits In
- What Renters Should Do in Today's Market
- What Landlords and Investors Should Do Now
- How Professional Management Reduces Vacancy Risk
- Where This Market Goes From Here
- Let Milwaukeepm Handle the Leasing While You Keep the Income
- Where These Numbers Came From
- Sources
Understanding the Milwaukee Rental Market Right Now
Anyone tracking the Milwaukee rental market has to reconcile several numbers that don't match. That's normal, and it's the first thing worth understanding before acting on any single figure.
Realtor named Milwaukee among the metros with the sharpest vacancy increases nationwide, tying the jump directly to a spike in multifamily supply concentrated at higher price points. It tells landlords units are sitting empty longer, and it tells renters leverage has shifted their way.
But vacancy doesn't tell you what rent actually costs, and here's where the confusion starts. Different trackers measure different things:
- Zillow ZORI (typical observed asking rent): about $1,469 as of June 2026, tracking new listings and lease renewals.
- ACS five-year gross rent (Census Bureau average across all occupied units, including older leases): roughly $1,059, a figure that reflects the broader housing stock rather than what's currently advertised.
- Apartment List median rent: near $1,193, based on its own listing sample.
- Zumper median: around $1,300 in a mid-2026 snapshot, reflecting yet another listing pool.
| Index | Latest Figure | What It Measures |
|---|---|---|
| Realtor.com vacancy | 10.8% (2025) | Share of rental units currently unoccupied |
| Zillow ZORI | ~$1,469 (June 2026) | Typical asking rent on active listings |
| $1,059 gross rent | ~$1,059 | Average rent across all occupied units, including long-term leases |
| Apartment List median | ~$1,193 | Median rent from its listing sample |
| Zumper median | ~$1,300 (July 2026) | Median rent from Zumper's own listings |
The spread between ACS and ZORI is the most important gap to grasp. ACS averages in tenants who signed leases years ago at lower rates, while ZORI captures what's happening on the market today. If you're a landlord pricing a vacant unit, ZORI and Zumper matter more. If you're assessing overall affordability for a neighborhood, ACS and HUD data matter more.
Why Vacancy Jumped: Construction, Permits, and Who Benefits
The vacancy spike didn't happen because renters left Milwaukee. It happened because developers built faster than the market could absorb new units. Multifamily permits nearly tripled between 2019 and 2024, and that pipeline is now delivering finished buildings at a pace the city hasn't seen in a decade.
Most of that new supply landed at the top of the market. Developers chased higher rents and better margins, which meant Class A buildings with amenities like fitness centers, covered parking, and in-unit laundry got built in volume, while affordable and mid-tier stock barely grew.
That's created a split market:
- Luxury and newer buildings are overbuilt relative to local demand, and concessions are returning in these properties as owners compete for tenants.
- Older, affordable units haven't seen the same construction wave, so vacancy in that segment remains comparatively tight.
- Elevated mortgage rates continue to keep would-be homebuyers in the rental pool longer, adding a modest counterweight to the supply glut.
For investors, this distinction matters more than the headline vacancy number. A Class A owner and an owner of a 1960s fourplex are operating in two different markets right now, even though they're both technically part of "the Milwaukee rental market."
Rent Trends: What Each Index Is Telling You
Rent growth in Milwaukee looks different depending on which tracker you check, and that inconsistency is exactly why picking the right index for your situation matters.
Apartment List's report shows rent growth outpacing state and national averages in some 2026 months, even as vacancy climbs. That's not a contradiction. It means asking rents on new listings are still rising in absolute terms, but landlords are increasingly using concessions rather than sticker-price cuts to stay competitive. A free month on a 12-month lease can knock 8% off the effective rent without ever touching the number posted online.

A quick way to think about net-effective rent: take the total concession value, divide it by the lease term, and subtract it from the advertised rent. A $1,500/month unit with one free month on a 12-month lease has a net-effective rent closer to $1,375.
Here's how to match the index to your role:
- Renters should watch Zillow ZORI and local listing sites, since those reflect what you'll actually be quoted today.
- Landlords should track both ZORI and Zumper for competitive positioning, then adjust for concessions to know their real net-effective rent.
- Investors evaluating acquisitions should weigh ACS gross rent alongside HUD figures to understand the affordability ceiling in a given neighborhood, not just the asking-rent headline.
Concessions are the detail most rent trackers miss entirely, since they report list price, not what tenants actually pay after move-in specials.
Where Rent and Vacancy Differ Across Milwaukee ZIP Codes
The citywide averages hide enormous variation block to block. A landlord or renter in 53202 (downtown/east side) is operating in a fundamentally different market than someone in 53215 (near south side).
Downtown-adjacent ZIPs with heavy new construction, like 53202, tend to show asking rents well above the city median, often paired with higher vacancy since so much of the new luxury supply landed there. Older, more affordable ZIPs on the south and northwest sides typically show lower asking rents and comparatively tighter vacancy, since little new inventory has arrived to compete with existing units.
What this means in practice:
- Landlords in high-rent, high-vacancy ZIPs need to budget for longer time-to-lease and factor concessions into their pricing from day one.
- Landlords in stable, lower-rent ZIPs can generally hold firmer on price, since demand hasn't loosened the way it has downtown.
- Investors screening acquisitions should treat ZIP-level vacancy as a stronger signal than the citywide 10.8% figure, since that number blends two very different submarkets.
- Renters targeting downtown-area units have more room to negotiate than renters targeting established neighborhoods with limited turnover.
Tenant screening income minimums should reflect the ZIP's actual rent level, not a citywide average. A screening standard built around a $1,469 downtown rent will disqualify perfectly good applicants for a $950 unit on the south side.
Affordability: Who Gets Priced Out and Where HUD Fits In
Rent figures only mean something when you compare them to what people actually earn. That's where HUD Fair Market Rents come in. HUD sets bedroom-specific FMRs for Milwaukee County each fiscal year, and those numbers double as the backbone for a standard affordability screen: multiply the FMR by 12, divide by 0.30, and you get the minimum annual income a household needs to spend no more than 30% of earnings on rent without being cost-burdened.
That threshold matters for three groups:
- Renters using housing vouchers, since HUD FMRs determine what a voucher will actually cover in a given unit size.
- Landlords participating in income-restricted or voucher programs, who need FMR figures to set compliant rent levels.
- Policy-minded investors assessing where the affordable-housing gap is widest, since ACS data shows a meaningful share of Milwaukee renter households already spend more than 30% of income on housing.
The gap between HUD FMR and market-rate ZORI figures is often the clearest sign of where a neighborhood's affordable stock is thinning out.
What Renters Should Do in Today's Market
Vacancy near 10.8% means landlords are more willing to negotiate than they've been in years. Use that leverage deliberately.
- Ask for concessions before signing, not after. Free months, reduced deposits, and included parking are all common right now, especially in newer Class A buildings.
- Target buildings showing signs of extended vacancy, like listings that have been live for more than 30 days or units advertising move-in specials.
- Come prepared with documentation, including pay stubs, ID, and rental history, so you can move faster than other applicants when you find a unit worth negotiating on.
- Compare net-effective rent, not just list price, across every unit you're considering.
Pro Tip: Ask the leasing office directly whether the unit has been vacant more than 45 days. Buildings sitting on unleased inventory are far more likely to approve a counteroffer than one that just hit the market.
What Landlords and Investors Should Do Now
Protecting income in this market means managing net-effective rent, not just defending the asking-rent number on your listing.
Start by modeling concessions transparently. If you're offering a half-month free to compete with nearby Class A buildings, calculate the actual monthly impact before you commit, and set your headline rent accordingly so you don't erode margin without realizing it.
Operational tactics matter as much as pricing:
- Invest in faster, higher-quality marketing photos and listings to cut time-to-lease, since every extra week of vacancy costs more than most concessions do.
- Offer flexible lease lengths (13 or 15 months instead of a flat 12) to stagger renewal dates and avoid bunched vacancy exposure.
- Keep maintenance turnaround tight between tenants; a structured approach to scheduling repairs shortens the gap between move-out and move-in more than most owners expect.
- At the portfolio level, consider whether aging Class A holdings need repositioning (updated amenities, adjusted pricing) versus affordable-stock units that may perform better simply held steady.
Pro Tip: Run the math on a $1,500 unit with a two-month concession on a 12-month lease. Your net-effective rent is $1,250, not $1,500. Price competitors against that real number, not their sticker price.
Owners managing several units can find more detailed operational tactics in this breakdown of effective management practices for Milwaukee rentals.
How Professional Management Reduces Vacancy Risk
A market with 10.8% vacancy punishes slow leasing and weak screening. Owners without dedicated marketing and screening systems are the ones absorbing the longest vacancy stretches right now.

Strong tenant screening practices reduce turnover by placing tenants who actually stay, which matters more when every vacant month costs real income in a softer market. Owner and tenant portals speed up rent collection and maintenance requests, cutting the friction that drags out lease terms. And a first-year tenant guarantee gives owners a real backstop if a placement doesn't work out, something that carries extra weight when vacancy risk is elevated citywide.
The measurable outcomes owners should expect from tighter management include:
- Shorter time-to-lease on vacant units
- Better tenant retention, reducing turnover costs
- Fewer missed rent payments through portal-based collection
Owners weighing their options can review broader guidance on choosing a Milwaukee property manager wisely in this environment.
Where This Market Goes From Here
Expect the current supply glut to take another 12 to 18 months to absorb, particularly in the Class A segment where most new units landed. Interest rates staying elevated will keep buyers renting longer, which softens the vacancy pressure somewhat but won't reverse it outright.
For renters, the decision is simple: lock in a lease now while concessions are common, rather than waiting for prices to fall further. For small investors, this is a moment to hold affordable-stock assets and avoid overpaying for Class A properties still working through oversupply. Institutional owners should expect another one to two quarters of concession-heavy leasing before the market rebalances.
— Chaim
Let Milwaukeepm Handle the Leasing While You Keep the Income
That's the real advantage here: while other owners are manually running comps across four different rent indices and negotiating concessions unit by unit, Milwaukeepm's tenant marketing, screening, and first-year tenant guarantee handle that work for you.
The owner and tenant portals keep rent collection, maintenance requests, and reporting in one place, so you're not chasing paperwork while vacancy pressure squeezes your margins elsewhere in the portfolio. Whether you own a single Class A unit competing against new luxury construction or a portfolio of affordable-stock rentals with steadier demand, the operational playbook is the same: fill units fast, screen tenants well, and keep net-effective rent protected.
Explore Milwaukeepm's full-service management options, or review the specific property management services available for Milwaukee owners, and get a plan in place before the next vacancy cycle hits your portfolio.
Where These Numbers Came From
The vacancy and rent figures in this article come from a handful of trackers worth bookmarking if you're monitoring the Milwaukee rental market yourself.
- CBS58's reporting on the vacancy jump and permit growth
- Realtor naming Milwaukee among the biggest vacancy movers
- Zillow ZORI data via RentMarker for current asking-rent benchmarks
- Apartment List's Milwaukee rent report for median rent and year-over-year trends
- HUD Fair Market Rent figures for affordability screening thresholds
Sources
- ‘More to rent than people’: Milwaukee rental vacancy jumps up
- Milwaukee turns renter-friendly as apartment vacancies surge
- Milwaukee rent report: Apartment List
- Milwaukee Rent Prices & Trends | Average Rent, Affordability & Housing Costs (2025)