
Track seven KPIs and you cover the property: net operating income, economic occupancy, operating expense ratio, rent collection rate, lease renewal and tenant retention, maintenance cost per square foot, and average days vacant. Start monthly tracking this month, assign one owner per metric, and put lease and capital expenditure decisions on a quarterly review calendar. Everything else on your dashboard should support these seven, not compete with them.
TL;DR:
- Economic occupancy provides a more accurate revenue picture than physical occupancy by accounting for rent arrears and concessions that reduce actual income.
- Net operating income should be analyzed by decomposing changes into rent and expense factors to identify growth drivers and avoid seasonal distortions.
- Regularly segment rent collections into aging buckets to catch early warning signs of tenant payment issues before they turn into write-offs.
- Operational KPIs such as maintenance cost per square foot and work order response times predict underlying asset health and prevent costly surprises.
- Review high-volatility metrics monthly and strategic KPIs quarterly to maintain reliable data and support timely decision-making.
Table of Contents
- What Are Commercial Property KPIs and Why Do They Matter?
- Core Financial KPIs That Drive Cash Flow and Valuation
- Leasing and Tenant KPIs That Predict Revenue Stability
- Operational KPIs That Reveal Hidden Costs
- How Often Should You Review Each KPI?
- How Do You Calculate the Most-Used Commercial Property KPIs?
- What Are Reasonable Benchmarks for Commercial Property KPIs?
- How Do You Interpret Conflicting KPI Signals?
- How Milwaukeepm Structures a Monthly Owner KPI Report
- A 90-Day Plan for Getting Your KPI Tracking Off the Ground
- Ready to Put These KPIs on Autopilot?
- Sources
What Are Commercial Property KPIs and Why Do They Matter?
A metric is any number you can measure. A KPI is a metric tied directly to a decision you need to make about valuation, leasing, or operations. Tracking your building's square footage is a metric. Tracking net operating income per square foot against last year is a KPI, because it tells you whether to raise rents, renegotiate a vendor contract, or list the asset for sale.
The most misunderstood distinction in commercial property reporting is physical occupancy versus economic occupancy. Physical occupancy counts leased square footage against total square footage. Economic occupancy measures actual collected rent against total potential rent at market rates. A building can show 95% physical occupancy while a tenant sits three months behind on rent, or while a big anchor negotiated a concession that quietly erodes revenue. Economic occupancy catches what physical occupancy hides.
Most owners drown their dashboards in numbers that don't drive decisions. A prioritized set beats a comprehensive one every time. When building your KPI list, anchor it to the choices you actually make:
- Do you need to adjust rents at renewal?
- Should you renegotiate a vendor contract or switch providers?
- Is this asset performing well enough to hold, or should you explore a sale?
If a metric doesn't inform one of those decisions, it's noise.
Core Financial KPIs That Drive Cash Flow and Valuation
Financial KPIs sit at the top of the hierarchy because they translate operations into dollars an investor or lender actually cares about.
Net operating income (NOI) is the anchor metric for commercial property valuation. The formula is straightforward:
- Add all revenue collected (rent, parking, fees, reimbursements).
- Subtract operating expenses (excluding debt service, depreciation, and capital expenditures).
- The remainder is your NOI.
A rising NOI number in isolation tells you little. Decomposing it, splitting the change into rent movement versus expense movement, tells you whether growth came from leasing strength or a one-time expense cut that won't repeat. Compare month over month rather than snapshot to snapshot, since seasonal utility swings and one-time repairs can distort a single period.
Operating expense ratio (OER) divides total operating expenses by effective gross income. An OER creeping upward over consecutive quarters usually signals one of three problems: a vendor contract that needs renegotiating, deferred maintenance catching up all at once, or a tax reassessment you haven't budgeted for.
Rent collection rate measures collected rent against billed rent for the period. The real diagnostic power comes from segmenting collections into aging buckets, current, 30, 60, and 90-plus days, because a tenant sliding into the 30-day bucket is an early warning that should trigger outreach before it becomes a write-off.
Cap rate (NOI divided by purchase price or current value) connects your operating performance to investor returns and resale value. It's the number brokers and lenders use to sanity-check your asking price.
Rental growth rate compares your rent trajectory to submarket comparables. Flat rents while the market moves up usually means you're underpricing renewals, not retaining goodwill.
- NOI: revenue minus operating expenses
- OER: operating expenses ÷ effective gross income
- Collection rate: collected rent ÷ billed rent
- Cap rate: NOI ÷ property value
Leasing and Tenant KPIs That Predict Revenue Stability
Financial KPIs tell you what already happened. Leasing and tenant KPIs tell you what's about to happen.
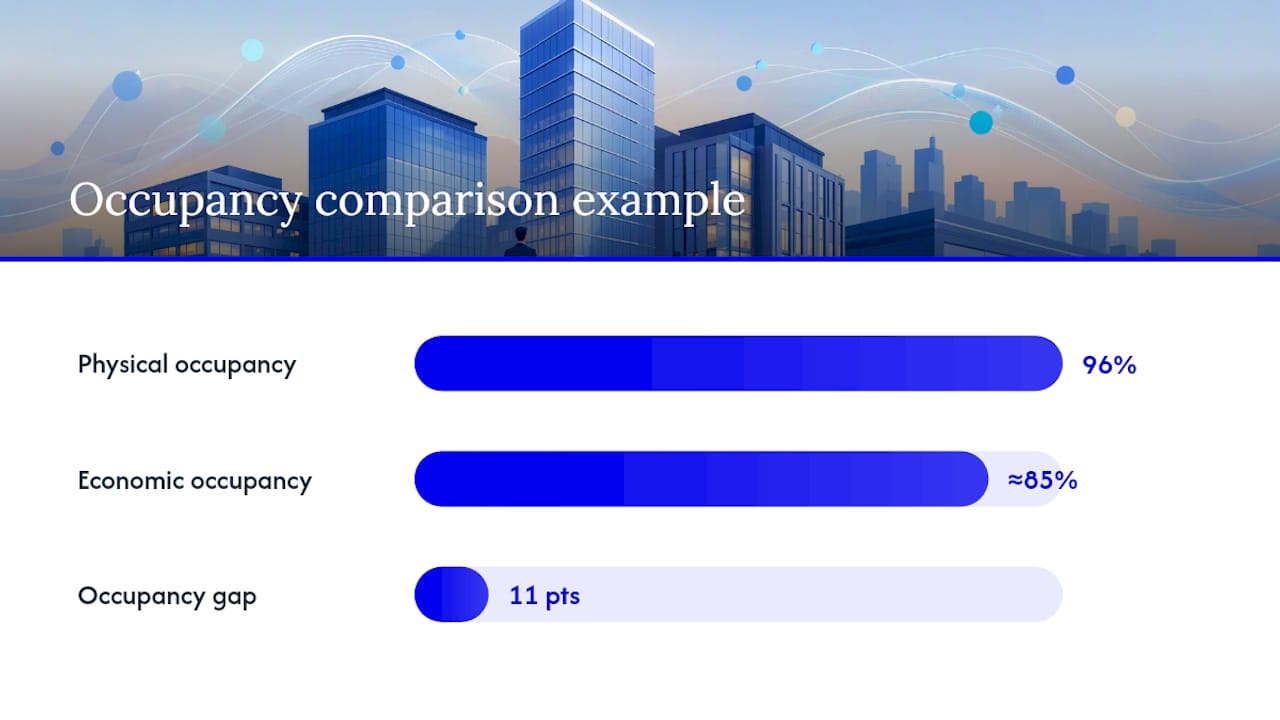
Physical occupancy is leased square footage divided by total rentable square footage. Economic occupancy is collected rent divided by total potential rent at full market rates. Say a 50,000 square foot building has 48,000 square feet leased (96% physical occupancy) but one tenant occupying 10,000 square feet pays half of market rate under a concession, and another 2,000 square feet sits in arrears. Economic occupancy drops closer to 85%, an 11-point gap that physical occupancy never reveals.
Lease renewal rate and tenant retention rate both divide renewed or retained tenants by total tenants up for renewal in the period. Retention typically delivers a better return than chasing new leasing, since you avoid the marketing spend, tenant improvement allowance, and vacancy gap that come with a fresh lease. A structured retention approach usually costs a fraction of what a new lease requires.
Occupancy cost percentage matters most for retail tenants. It's total occupancy cost divided by tenant sales, and landlords use it to gauge whether a tenant is financially healthy enough to renew or at risk of requesting relief.
Average days vacant and vacancy loss quantify the cost of turnover. Multiply vacant days by daily potential rent to see the dollar drain, then compare against your marketing and turnover process to find where time leaks out.
- Physical occupancy: leased SF ÷ total rentable SF
- Economic occupancy: collected rent ÷ total potential rent
- Retention rate: retained tenants ÷ tenants up for renewal
- Average days vacant: total vacant days ÷ number of vacancies
Operational KPIs That Reveal Hidden Costs
Operational KPIs rarely show up on an investor's radar, but they're often the earliest signal that something bigger is wrong.
Maintenance cost per square foot (or per unit) only means something when benchmarked against similar asset classes, since a Class A office building and a light industrial flex space carry very different baseline costs. Unexplained departures from your own historical average, or from comparable properties, usually point to a procurement problem or an underperforming vendor rather than random bad luck.
Work order response time should be tiered: emergency issues (flooding, no heat) answered within hours, urgent issues within a day, and routine requests within a set window, often 48 to 72 hours. Resolution time measures how long the fix actually takes once a technician arrives, and it's a separate number worth tracking on its own.
First-visit resolution rate tracks how often a work order closes after a single visit. A low rate usually means techs arrive without the right parts or diagnostic information, which drives up both cost and tenant frustration.
- Maintenance cost per SF: total maintenance spend ÷ rentable square footage
- Response time tiers: emergency, urgent, routine, each with its own target window
- First-visit resolution: orders closed in one visit ÷ total orders
Pro Tip: Watch how operational numbers show up downstream. A slipping first-visit resolution rate today often becomes a rising OER two quarters from now, once repeat visits and emergency callouts pile up.
How Often Should You Review Each KPI?
Review frequency should match how fast a metric moves, not a fixed calendar habit. Analysts generally recommend reviewing high-volatility operational numbers monthly and slower-moving strategic numbers quarterly.
- Monthly: rent collection rate and aging buckets, economic occupancy, maintenance cost trends, and work order volume.
- Quarterly: lease expiry profile, renewal rate trends, capital expenditure planning, and cap rate movement against market comps.
- As triggered: anything crossing a preset threshold, like collections sliding past 30 days or OER jumping more than a few points in one period.
Your dashboard should mirror this split, with a monthly operating view and a quarterly strategic view rather than one undifferentiated wall of numbers. Owners typically want the summary and the trend lines; property managers need the underlying detail to act on it.
Data quality determines whether any of this works. Use one accounting system as the source of truth, code expenses consistently across properties so comparisons hold up, and reconcile lease data, accounting entries, and maintenance system entries against each other monthly. Structured reporting frameworks exist for exactly this reason, and following one saves you from rebuilding your own each quarter.

How Do You Calculate the Most-Used Commercial Property KPIs?
Here are the formulas you'll use most, with a worked example for the two that trip owners up most often.
- NOI = Total revenue − Operating expenses (excluding debt service and capex)
- OER = Operating expenses ÷ Effective gross income
- Physical occupancy rate = Leased SF ÷ Total rentable SF
- Economic occupancy = Collected rent ÷ Total potential rent at market rate
- Rent collection rate = Collected rent ÷ Billed rent
- Lease renewal rate = Renewed tenants ÷ Tenants up for renewal
- Maintenance cost per SF = Total maintenance spend ÷ Rentable SF
- Average days vacant = Total vacant days ÷ Number of vacancies
Worked example, NOI: A 40,000 square foot building collects $600,000 in annual revenue and carries $220,000 in operating expenses. NOI = $380,000, or $9.50 per square foot.
Worked example, economic occupancy: That same building has full market rent potential of $650,000. Even with 98% physical occupancy, if actual collections land at $600,000, economic occupancy is 92.3%, a gap worth investigating in the aging report before it grows.
Always normalize by square footage or unit count when comparing properties of different sizes, and adjust for seasonal swings (utility costs, snow removal) before drawing conclusions from a single month.
What Are Reasonable Benchmarks for Commercial Property KPIs?
Benchmarks vary sharply by asset class, submarket, and property age, so treat any range as a starting point, not a scorecard.
- Economic occupancy in the low to mid 90s is generally considered healthy for stabilized assets; anything trending down for two consecutive quarters deserves a closer look.
- OER commonly runs lower for net-leased industrial and higher for full-service office, since the expense responsibilities differ by lease structure.
- Maintenance cost per square foot varies by asset class and building age, which makes peer comparison more useful than a single universal target.
Market-level housing and occupancy data from the Census Bureau offers a useful outside reference point when your submarket lacks good comparable data, and resources like Lacuna Index's real estate benchmarks can round out sector comparisons. Track your own trend line for at least four to six quarters before treating any single-period dip as a real problem rather than noise from a one-time expense or a slow collection month.
How Do You Interpret Conflicting KPI Signals?
Individual KPIs mislead when read alone. High physical occupancy paired with sliding economic occupancy usually means concessions or arrears are quietly eating revenue that a leasing report won't show you. The fix is a standing cross-check routine, not a one-time audit.
- Decompose NOI whenever it moves: was the change driven by rent, vacancy, or expenses?
- Reconcile physical occupancy against the aging report and any active concessions each month.
- Watch for a rising OER paired with flat maintenance activity, which usually points to a contract or billing issue rather than actual wear and tear.
When multiple red flags appear together, prioritize the fix with the fastest cash impact first, usually collections outreach, then move to structural issues like vendor renegotiation or capital planning that take longer to resolve.
How Milwaukeepm Structures a Monthly Owner KPI Report
A useful monthly report opens with a one-page summary of the core numbers, followed by trend charts, an income and expense breakdown, a list of open maintenance items, and a lease expiry summary for the next twelve months.
Milwaukeepm builds owner and tenant portals around exactly this structure, giving owners transparent monthly reporting without waiting on a phone call for updates. Tenants log maintenance requests directly through their portal, which shortens response time and feeds cleaner data into your work order KPIs. Milwaukeepm's first-year tenant guarantee also gives owners more confidence in the retention and occupancy numbers on that report, since a tenant walking away early carries a built-in safeguard.
- Summary page: NOI, occupancy, collection rate at a glance
- Trend charts: month over month and year over year
- Maintenance log: open items and resolution status
- Lease expiry summary: upcoming renewals and risk flags
A 90-Day Plan for Getting Your KPI Tracking Off the Ground
Month one is about gathering clean data: pull twelve months of financials, occupancy records, and maintenance logs, then set your baselines and build a simple dashboard.
Month two is reconciliation. Discrepancies between your accounting system and your lease file will surface here, so assign one person to own each KPI before you move forward.
Month three is when you set real targets, start monthly reporting on schedule, and put lease and capital decisions on a quarterly review calendar. Skip straight to targets before your baseline is trustworthy, and you'll be optimizing against bad numbers.
— Chaim
Ready to Put These KPIs on Autopilot?
Building the dashboard is one thing. Keeping it accurate every month, chasing down aging reports, reconciling maintenance logs, and turning raw numbers into a report an investor can actually use, is where most owners lose momentum. Milwaukeepm handles that work directly, pairing full-service commercial management with owner and tenant portals built to keep economic occupancy, collections, and maintenance costs visible without you digging through spreadsheets each month.
That means consistent monthly reports instead of scrambled quarter-end catch-up, tighter collections because tenants have an easy portal to pay through, and lower vacancy loss thanks to proactive tenant screening backed by a first-year guarantee. If you want your KPI tracking handled by people who already build these reports every month, take a look at Milwaukeepm's full service breakdown and request a proposal for your property today.
Sources
- Census Bureau — Housing Vacancy Survey
- CommLoan research — operating expense and collections guidance
- TwoChi — commercial property management KPIs overview